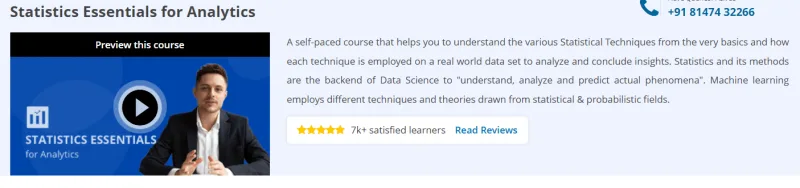
What will you learn in Statistics Essentials for Analytics Course
-
Grasp core statistical concepts: descriptive statistics, probability distributions, sampling, and data visualization
-
Apply inferential techniques: confidence intervals, hypothesis testing (t-tests, chi-square, ANOVA) for data-driven decisions
-
Build and interpret simple predictive models: linear and logistic regression fundamentals
-
Understand non-parametric tests (Mann–Whitney, Kruskal–Wallis) for data that violate parametric assumptions
-
Explore time-series basics: trend decomposition, autocorrelation, and forecasting fundamentals
Program Overview
Module 1: Foundations of Statistical Thinking
⏳ 1 week
-
Topics: Populations vs. samples, scales of measurement, exploratory data analysis principles
-
Hands-on: Summarize a dataset with measures of central tendency and dispersion
Module 2: Probability & Distributions
⏳ 1 week
-
Topics: Basic probability rules, discrete (Binomial, Poisson) and continuous (Normal, Exponential) distributions
-
Hands-on: Compute and visualize distribution PDFs and CDFs; simulate random sampling
Module 3: Sampling & Estimation
⏳ 1 week
-
Topics: Sampling methods, Central Limit Theorem, point vs. interval estimation
-
Hands-on: Derive and interpret confidence intervals for means and proportions
Module 4: Hypothesis Testing
⏳ 1 week
-
Topics: Null/alternative setup, Type I/II errors, p-values, one- and two-sample t-tests, chi-square tests
-
Hands-on: Conduct and report results of a t-test and chi-square goodness-of-fit test
Module 5: Comparing Multiple Groups
⏳ 1 week
-
Topics: One-way and two-way ANOVA, assumptions checking, post-hoc analysis
-
Hands-on: Analyze variance across groups and apply Tukey’s HSD for pairwise comparisons
Module 6: Non-Parametric Methods
⏳ 1 week
-
Topics: Mann–Whitney U, Wilcoxon signed-rank, Kruskal–Wallis tests
-
Hands-on: Use non-parametric tests on skewed or ordinal data
Module 7: Regression Analysis Essentials
⏳ 1 week
-
Topics: Simple linear regression, least squares estimation, logistic regression basics
-
Hands-on: Fit and interpret a linear model; assess goodness-of-fit and residuals
Module 8: Introduction to Time Series
⏳ 1 week
-
Topics: Trend, seasonality, autocorrelation, moving averages, ARIMA overview
-
Hands-on: Decompose a time series and generate a basic forecast
Get certificate
Job Outlook
-
Data Analyst: $65,000–$90,000/year — use statistics to derive business insights and inform strategy
-
Business Intelligence Specialist: $70,000–$100,000/year — design dashboards, perform ad hoc analyses, and report results
-
Quality Analyst / Statistician: $60,000–$85,000/year — apply statistical methods to ensure process and product quality
-
Foundational statistics skills are essential across finance, healthcare, marketing analytics, and engineering domains.
Explore More Learning Paths
Strengthen your analytics foundation with these expert-curated programs designed to expand your statistical knowledge and accelerate your journey into data science and advanced decision-making.
Related Courses
-
Statistics with Python Specialization Course – Build a solid statistical foundation using Python, covering probability, inference, and applied statistics for real-world data problems.
-
Bayesian Statistics: From Concept to Data Analysis Course – Learn Bayesian thinking, modeling, and data analysis techniques widely used in modern analytics and machine learning.
-
Python and Statistics for Financial Analysis Course – Combine Python programming with core statistical methods to analyze financial data and uncover actionable insights.
Related Reading
Deepen your understanding of how data is structured, governed, and used in analytical environments:
-
What Is Data Management? – Explore how data collection, storage, organization, and governance form the backbone of effective analytics.