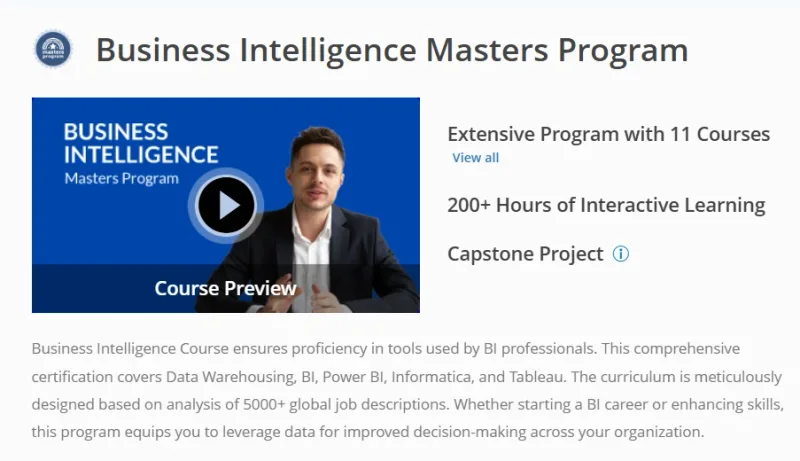
What will you learn in Business Intelligence Masters Program
-
Understand the full spectrum of business intelligence processes and tools
-
Gain hands-on expertise with Power BI, Tableau, SQL, and data warehousing
-
Learn data modeling, visualization, dashboarding, and storytelling techniques
-
Develop ETL pipelines, analyze large datasets, and automate reporting
-
Prepare for roles in BI analysis, data analytics, and reporting architecture
Program Overview
Module 1: Power BI Certification Training
⏳ 3 weeks
-
Topics: Power BI desktop, DAX functions, data modeling, Power Query
-
Hands-on: Build interactive dashboards and publish them on Power BI Service
Module 2: Tableau Certification Training
⏳ 3 weeks
-
Topics: Tableau desktop, visual analytics, filters, parameters, calculated fields
-
Hands-on: Create storyboards and design business dashboards using Tableau
Module 3: SQL for Data Analysis
⏳ 2 weeks
-
Topics: SQL queries, joins, subqueries, aggregation, window functions
-
Hands-on: Write queries to extract and analyze data from relational databases
Module 4: Data Warehousing and ETL
⏳ 2 weeks
-
Topics: Dimensional modeling, star/snowflake schema, ETL concepts
-
Hands-on: Design a data warehouse and simulate ETL workflows
Module 5: Data Visualization with Advanced Excel
⏳ 1 week
-
Topics: Pivot tables, conditional formatting, charts, formulas
-
Hands-on: Build Excel-based dashboards and KPI scorecards
Module 6: BI Project and Certification Prep
⏳ 1 week
-
Topics: BI architecture, project planning, mock interviews
-
Hands-on: Solve a real-world BI case study using combined toolsets
Get certificate
Job Outlook
-
BI skills are in high demand across industries like retail, finance, healthcare, and tech
-
Roles include BI Analyst, Data Analyst, Reporting Analyst, and Analytics Consultant
-
Average global salary ranges from $85,000 to $130,000+ based on expertise
-
Business intelligence is a critical function in data-driven organizations
Explore More Learning Paths
Elevate your business intelligence skills with these carefully selected programs designed to sharpen your data analysis capabilities and empower you to make data-driven decisions with confidence.
Related Courses
-
Generative AI for Business Intelligence (BI) Analysts Specialization Course – Learn how to leverage AI tools to enhance BI processes, automate insights, and drive smarter business decisions.
-
Foundations of Business Intelligence Course – Build a solid foundation in BI concepts, data visualization, and reporting techniques to analyze business performance effectively.
-
Google Business Intelligence Professional Certificate Course – Gain practical experience with Google BI tools and workflows, preparing you for real-world BI projects.
Related Reading
-
What Is Data Management? – Explore the essential practices of organizing, maintaining, and analyzing data to support informed business decisions.